Python3
- Collect Japanese stock price information with Python
- Check the function of pandas library
- How to extract list data from aggregated ranking data
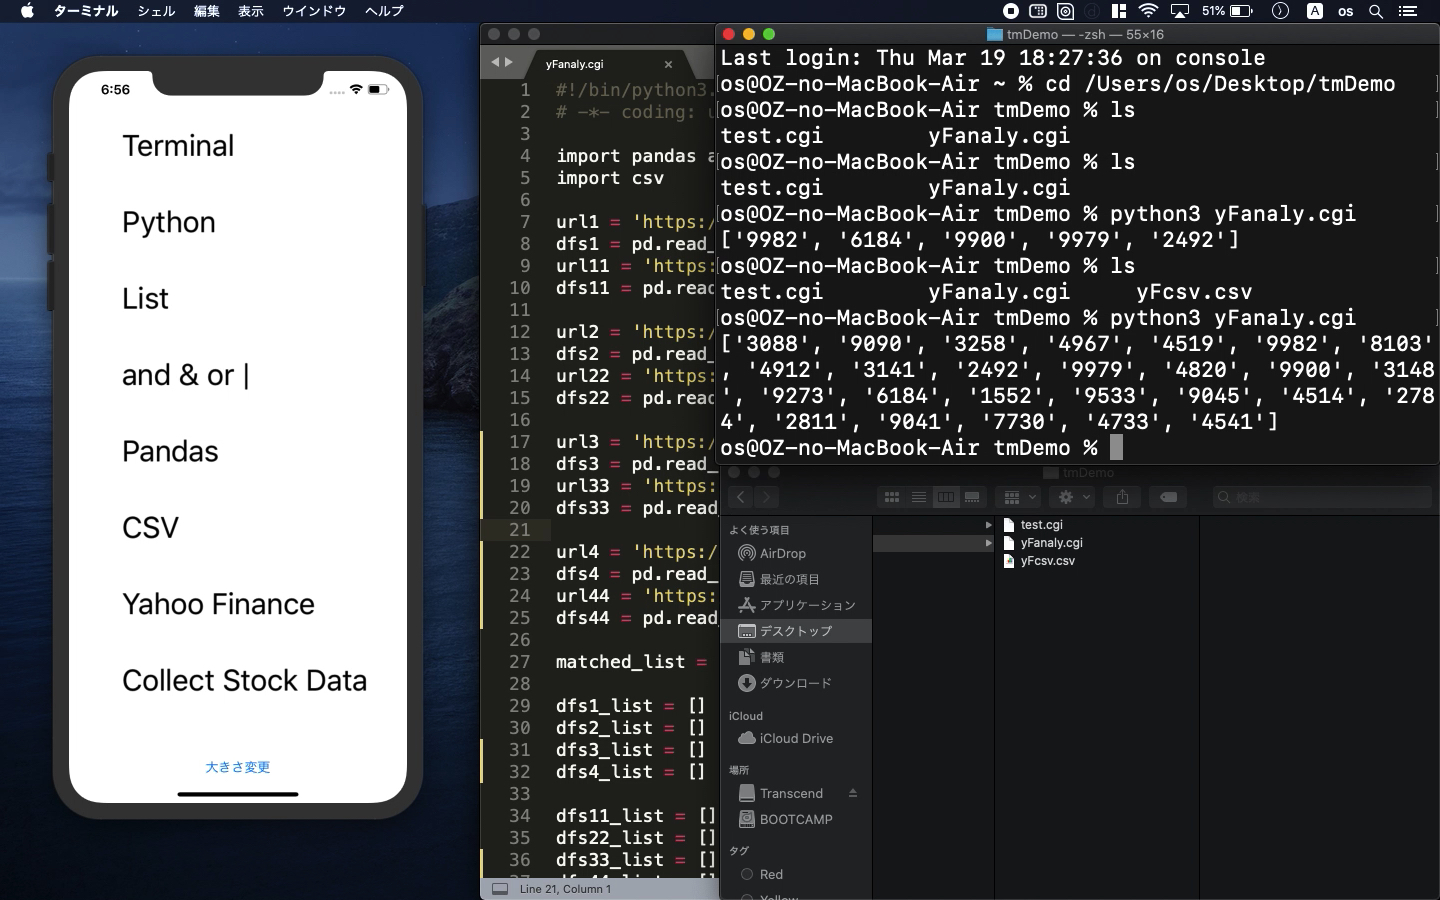
* Here is the highlight of YouTube tutorial.
Yahoo jp finance is one of the Japanese famous tools to check stock information
such as price volatility ranking. With python, you can customize and extract
necessary information for your easy trading.
Before doing so, let's review the python function of listed data. Here
is the example.
dfs1_list = [11,44]
dfs2_list = [22,44]
df1_set = set(dfs1_list)
df2_set = set(dfs2_list)
matched_list = list(df1_set & df2_set)
print(matched_list)
After you convert the list type to set type, you can compare some aggregated
list data and extract the common number 44 from two list with the letter
of and:&.
On the other hand, you can also use or:| function with the following code.
matched_list = list(df1_set | df2_set)
print(matched_list)
In this way, you can collect all of the listed information, 11, 22, and
44. This basic function are very convenient for many purposes.
Now, let's see how to hack Yahoo jp finance. I will use these two libraries.
import pandas as pd
import csv
The url structure is as follows;
https://info.finance.yahoo.co.jp/ranking/?kd=1&p=2
It has two parameters. "kd=" means the kinds of ranking. If you
change it to 9 for example, you can collect the ranking of PER, instead.
On the other hand, "p=" means the page number of ranking. "p=2"
is for the ranking from 51 to 100 so one page has 50 ranking information.
url1 = 'https://info.finance.yahoo.co.jp/ranking/?kd=1'
dfs1 = pd.read_html(url1)
url11 = 'https://info.finance.yahoo.co.jp/ranking/?kd=1&p=2'
dfs11 = pd.read_html(url11)
url2 = 'https://info.finance.yahoo.co.jp/ranking/?kd=9'
dfs2 = pd.read_html(url2)
url22 = 'https://info.finance.yahoo.co.jp/ranking/?kd=9&p=2'
dfs22 = pd.read_html(url22)
Python library of pandas can get the table data from html so let me collect
the bond number of specific stock information. In Japan, each stock has
one bond identification number with 4 digit. I will collect this number.
matched_list = []
dfs1_list = []
dfs11_list = []
dfs1Arr = str(dfs1[0:50][0]).splitlines()
dfs11Arr = str(dfs11[0:50][0]).splitlines()
for elm in dfs11Arr:
dfs1Arr.append(elm)
The collected str type can be converted into array with splitlines() command.
And, two of 50 aggregated data can be combined with the loop command. In
this way, you can get the ranking data from 1 to 100.
The aggregated data can be analyzed with the following codes as shown at
the top.
df1_set = set(dfs1_list)
df2_set = set(dfs2_list)
matched_list = list((df1_set & df2_set))
You can also save the collected data as CSV file on the designated directory.
Here is the example.
matched_list = []
dfs1_list = []
dfs11_list = []
dfs1Arr = str(dfs1[0:50][0]).splitlines()
dfs11Arr = str(dfs11[0:50][0]).splitlines()
for elm in dfs11Arr:
dfs1Arr.append(elm)
In this example, you can collect high PER stock bond number from price
volatility group of ranking from 1 to 100.
Let me demonstrate it on my YouTube tutorial.
To get the source code, check the comment of my YouTube
Back to Table List